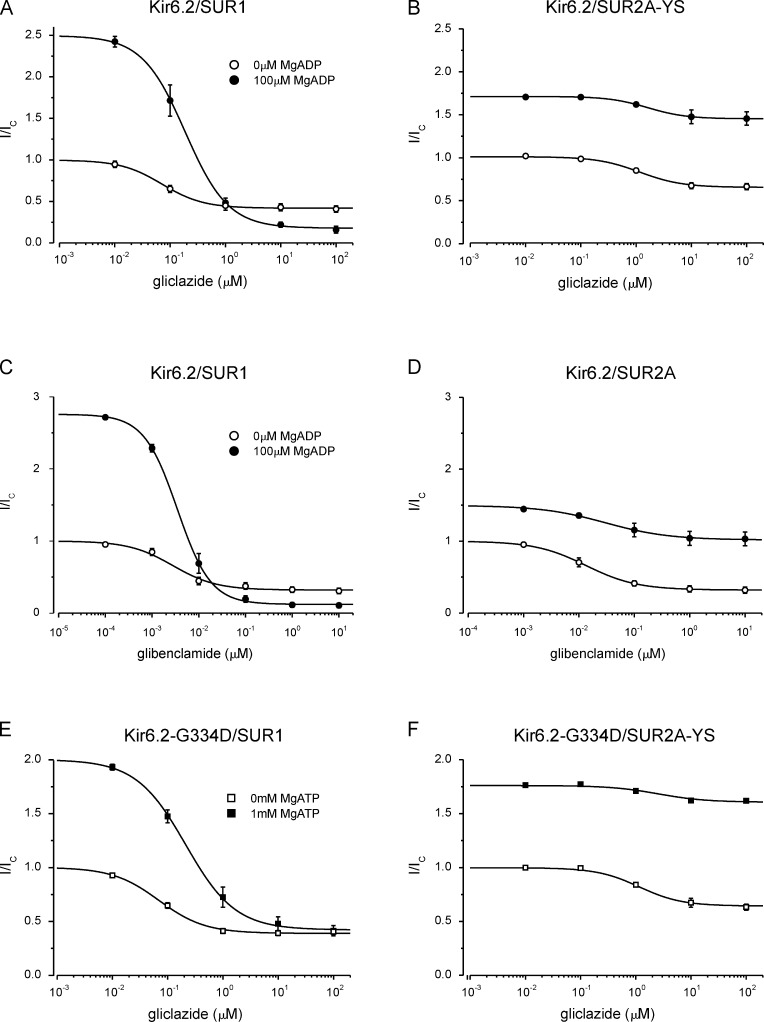
Figure 6.
Effect of MgADP and MgATP on gliclazide inhibition of Kir6.2/SUR1 and Kir6.2/SUR2A-YS. (A–F) Data are the same as in Fig. 5 (A–F), but currents in the presence of gliclazide (I) are expressed as a fraction of that in drug- and nucleotide-free solution (Ic). (A and B) Concentration-response relationships for gliclazide inhibition of Kir6.2/SUR1 (A) and Kir6.2/SUR2A-YS (B) channels in the presence and absence of 100 µM MgADP. The lines are the best fit of Eq. 1 to the mean data: IC50 = 72 nM, h = 1.1, a = 0.42 (A, open circles; n = 6); IC50 = 187 nM, h = 1.1, a = 0.18, L = 2.5 (A, closed circles; n = 6); IC50 = 1.3 µM, h = 1.1, a = 0.65 (B, open circles; n = 5); IC50 = 1.6 µM, h = 1.2, a = 1.61, L = 1.7 (B, closed circles; n = 5). (C and D) Concentration-response relationships for glibenclamide inhibition of Kir6.2/SUR1 (C) and Kir6.2/SUR2A (D) channels in the presence and absence of 100 µM MgADP. The lines are the best fit of Eq. 1 to the mean data: IC50 = 2.8 nM, h = 0.93, a = 0.32 (C, open circles; n = 6); IC50 = 3.7 nM, h = 1.2, a = 0.12, L = 2.8 (C, closed circles; n = 6); IC50 = 13 nM, h = 0.94, a = 0.32 (D, open circles; n = 5); IC50 = 30 nM, h = 0.75, a = 1.02, L = 1.5 (D, closed circles; n = 5). (E and F) Concentration-response relationships for gliclazide inhibition of Kir6.2-G334D/SUR1 (E) and Kir6.2-G334D/SUR2A-YS (F) channels in the presence and absence of 1 mM MgATP. The lines are the best fit of Eq. 1 to the mean data: IC50 = 70 nM, h = 1.0, a = 0.39 (E, open squares; n = 6); IC50 = 210 nM, h = 1.0, a = 0.42, L = 2.0 (E, closed squares; n = 6); IC50 = 1.3 µM, h = 1.2, a = 0.64 (F, open squares; n = 5); IC50 = 2.5 µM, h = 1.0, a = 1.44, L = 1.8 (F, closed squares; n = 5). Mean ± SEM.

