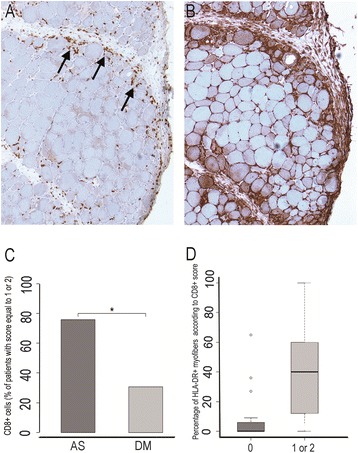
Figure 4.

CD8+ T-cell infiltration and myofiber HLA-DR expression. A, B: Comparison of CD8+ T-cells infiltration and myofiber HLA-DR expression in a same case of ASM. CD8+ T-cells (arrows) are detected in perifascicular endomysium and adjacent perimysium (A), in the areas corresponding to those of the strongest myofiber HLA-DR expression (B). Frozen section; immunoperoxidase technique for CD8 and HLA-DR. C: Percentage of patients with a CD8+ score equal to 1 or 2, in ASM and DM; (*) indicates p < 0.05. D: Percentage of HLA-DR-positive myofibers according to the degree of CD8+ T-cell infiltration. Comparison was done between patients with a CD8+ score null and patients with score equal to 1 or 2, ASM and DM patients having been pooled.
