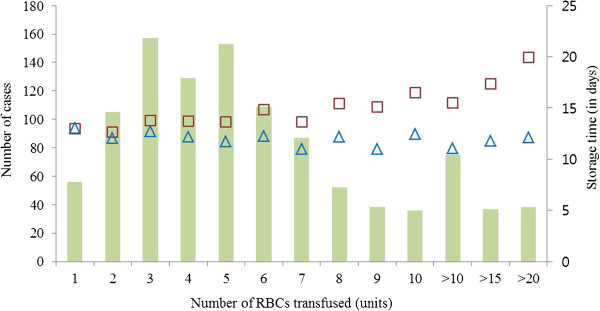
Figure 2.

Transfusion amounts per patient and its relationship with the RBCs age. Bars represent the number of cases for each transfusion amounts. In each number of transfusions, squares (□) represent the average value of ‘oldest age of transfused RBCs’ and triangles (△) represent the average value of ‘mean age of transfused RBCs’. RBC, red blood cell.
