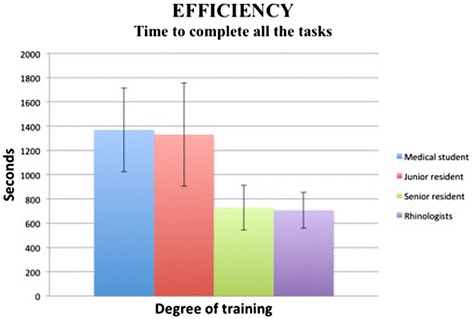
Figure 4.

Time to complete the simulation tasks. The graph represents means +/- SD. Statistically significant difference (p < 0.005) between junior residents and senior residents. No difference between medical students and junior residents, nor between senior residents and attending faculty.
