
Figure 3.
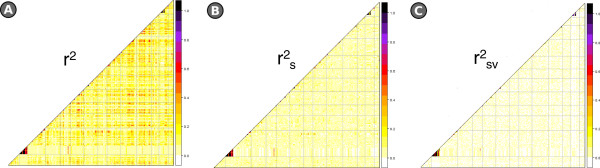
Heat maps indicating genome-wide variation in LD across the genome. A) r2 model, B) r2 s model, C) r2 sv model.
Official websites use .gov
A
.gov website belongs to an official
government organization in the United States.
Secure .gov websites use HTTPS
A lock (
) or https:// means you've safely
connected to the .gov website. Share sensitive
information only on official, secure websites.
Heat maps indicating genome-wide variation in LD across the genome. A) r2 model, B) r2 s model, C) r2 sv model.