Figure 1.

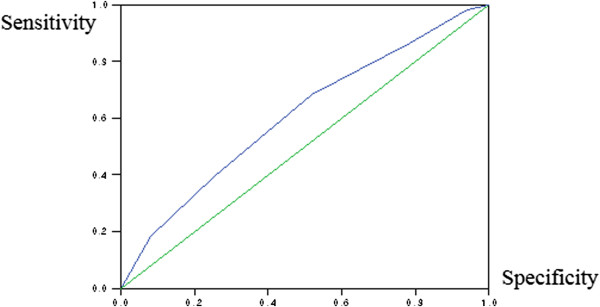
Area under the receive operating curve (ROC) for the symptom score. The AUC of the ROC curve was 0.610 ± 0.029. The probability of higher symptom scores for asthma group was 61% greater than for the control group.

Area under the receive operating curve (ROC) for the symptom score. The AUC of the ROC curve was 0.610 ± 0.029. The probability of higher symptom scores for asthma group was 61% greater than for the control group.