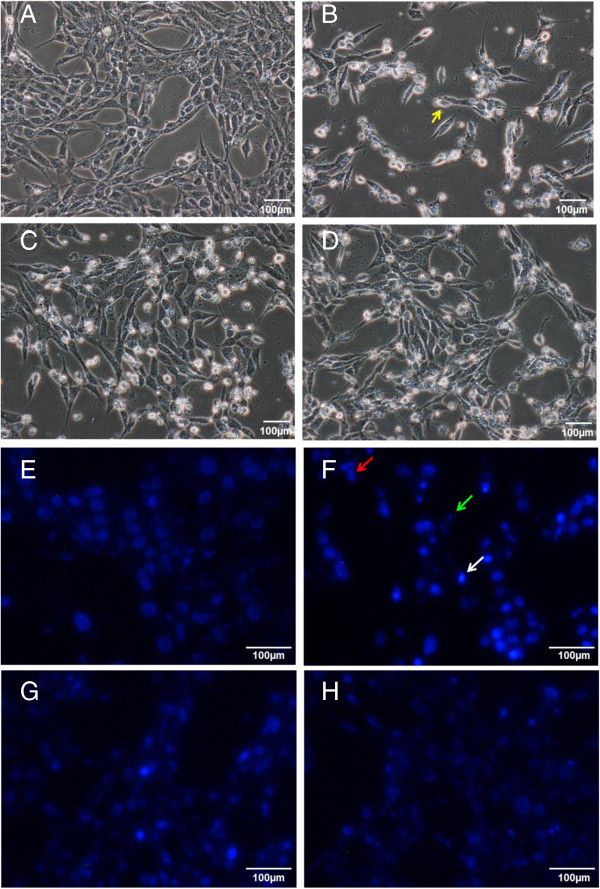
Figure 2.

Effect of EBN extracts on morphological and nuclear changes of 6-OHDA-challenged SH-SY5Y cells. Microscopic images were taken after 48 hours of treatment. Figures A-D are bright field images while Figures E-H are fluorescent images taken after Hoechst 33258 staining. Figures A and E: control group; Figures B and F: 6-OHDA group; Figures C and G: S1 MNTD + 6-OHDA-treated group; Figures D and H: S2 MNTD + 6-OHDA-treated group. Cell shrinkage is indicated by cell losing its distinctive neuronal shape and has becomes smaller in size (yellow arrow in Figure 2B), DNA fragmentation is indicated by cluster of nuclei fragments (red arrow in Figure 2F), shrunken cell is indicated by smaller and distorted nuclei (green arrow in Figure 2F) while nuclear chromatin condensation is indicated by brightly fluorescent nuclei (white arrow in Figure 2F).
