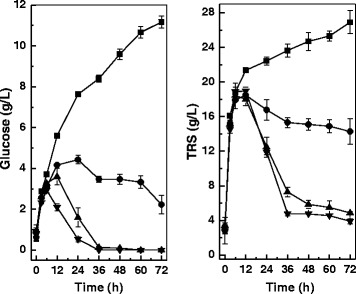
Figure 2.

Sugar evolution profiles of the simultaneous saccharification and lipid production process by Cryptococcus curvatus in different solutions. Square, potassium phosphate buffer; circle, nutrient solution plus 0.1 g/L (NH4)2SO4; triangle, nutrient solution plus 0.5 g/L (NH4)2SO4; inverted triangle, nutrient solution plus 1.0 g/L (NH4)2SO4. TRS, total reducing sugars.
