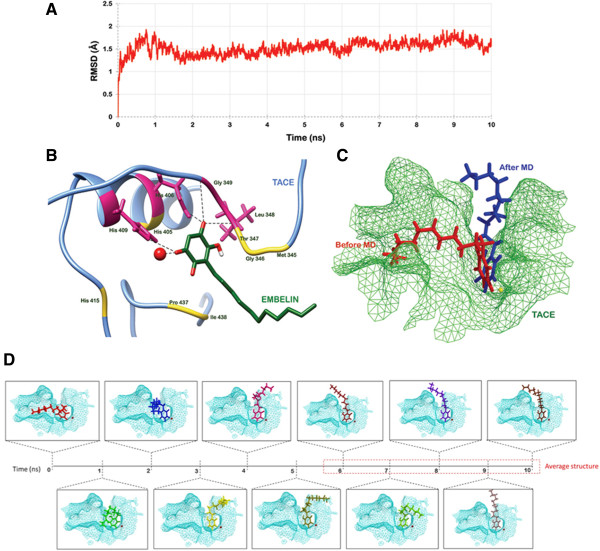
Figure 2.

Kinetic of embelin docking to TACE. (A) Trajectory showing root mean square deviation in the conformation of TACE backbone in reference to the docked complex over the entire simulation run. (B) Molecular interaction pattern between TACE and embelin after MD simulations. (C) Difference in the binding pose of embelin before (red) and after (blue) MD simulation. (D) Changes observed in the docking conformation of embelin during the simulations of 10 ns duration.
