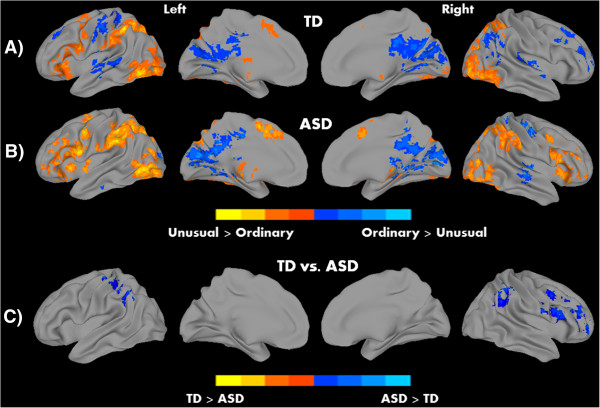
Figure 3.

Within-group results for A) typically developing (TD) and B) autism spectrum disorder (ASD) groups, and C) significant between-group differences for the contrast unusual versus ordinary. Warm colors represent Unusual > Ordinary and cool colors Ordinary > Unusual; P <0.05, corrected.
