
Figure 1.
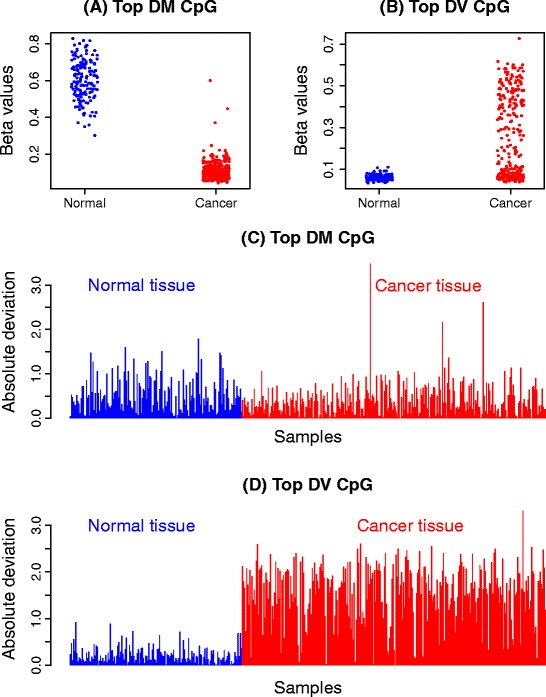
Differential methylation (DM) and differential variability (DV) in the kidney cancer methylation data set. (A) and (C) show the β values and absolute deviations of the most significantly differentially methylated CpG site between the normal and cancer samples. There is an obvious shift in mean between cancer and normal (A), but in (C) the variability in both groups looks very similar. (B) and (D) show the β values and absolute deviations of the most significantly differentially variable CpG site between the normal and cancer samples. It is clear that the variability of the cancer and normal groups are very different, with very large deviations in the cancer group and consistently small deviations in the normal group apparent in (D). DM, differential methylation; DV differential variability.