
Figure 2.
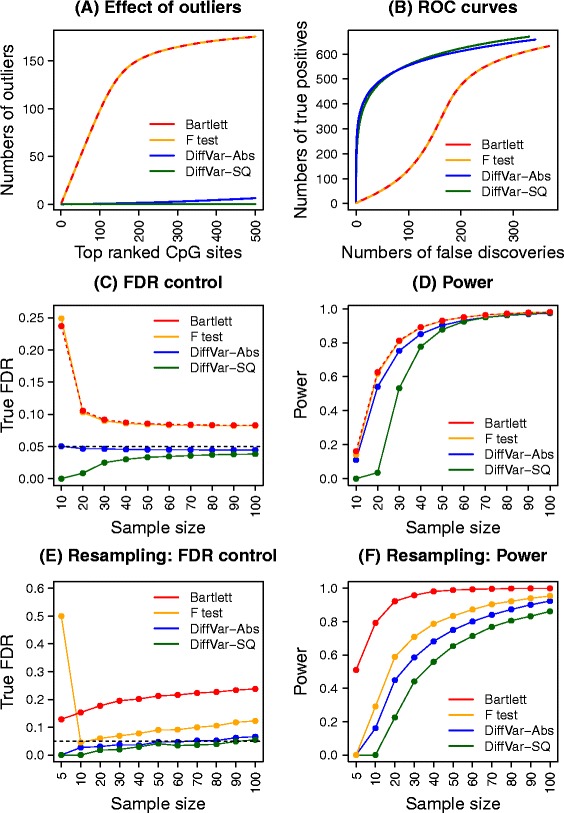
Performance of the four different methods using simulations. Results shown in plots (A-D) are averaged over 1000 simulated data sets and results shown in plots (E) and (F) are averaged over 100 resampled data sets at each sample size. (A) Cumulative numbers of differentially variable CpG probes containing outlier observations when ranking by the four different methods. There are no differentially variable CpGs simulated but 200 outliers are included in the data. (B) ROC curves when 200 outliers and 1000 differentially variable CpGs are present in the simulated data. (C) Control of the FDR of the four methods at a 5% nominal FDR cut-off (horizontal dashed black line) over ten different sample sizes. This simulation contains 1000 CpGs that are roughly five times more variable in Group 2 compared with Group 1. (D) The power to detect differentially variable features at ten different sample sizes when Group 2 is roughly five times more variable than Group 1. (E) Control of the FDR using resampled kidney cancer data sets at 11 different sample sizes. (F) The power to detect differentially variable features using resampled kidney cancer data sets at 11 different sample sizes. Abs, absolute deviations; FDR, false discovery rate; ROC, receiver operating characteristic; SQ, squared deviations.