
Figure 3.
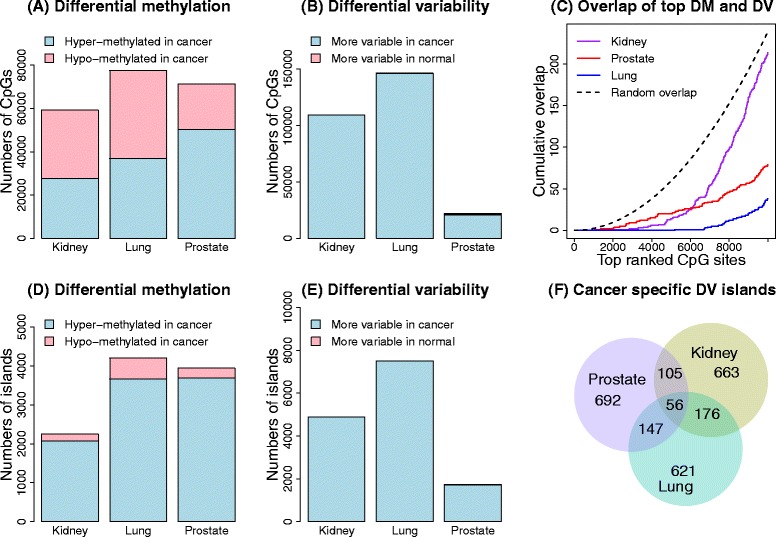
Analysis of the three TCGA data sets. The top row shows the results of the CpG site-level analysis and the bottom row the results of the CpG-island-level analysis. (A) Numbers of significantly differentially methylated CpG sites for the three cancer data sets. (B) Numbers of significantly differentially variable CpG sites for the three cancer data sets. (C) Overlap of the top differentially methylated (DM) and top differentially variable (DV) CpG sites for each cancer data set separately. The dotted line shows the median overlap profile of two sets of 10,000 randomly selected CpGs. The random sampling was repeated 1000 times. (D) Numbers of significantly differentially methylated CpG islands. (E) Numbers of significantly differentially variable CpG islands. (F) Proportional Venn diagram of the overlap of the top differentially variable CpG islands between the three different cancers. DM, differential methylation; DV differential variability.