
Figure 5.
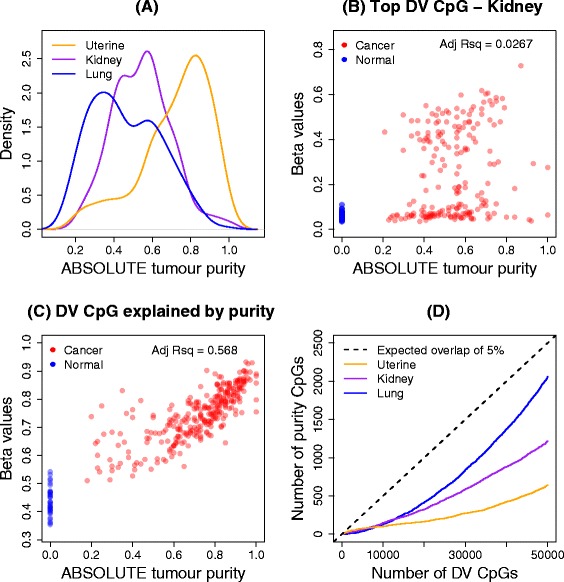
Effect of tumour purity on methylation signal in three TCGA cancer data sets. (A) Distribution of the ABSOLUTE tumour purity estimates for uterine, kidney and lung cancer data sets. (B) Correlation of ABSOLUTE tumour purity estimates with the methylation signal for the top-ranked differentially variable CpG site in the kidney data set. (C) Correlation of ABSOLUTE tumour purity estimates with the methylation signal for a CpG site that is classified as differentially variable and differentially methylated, and has a large adjusted R-squared value in the uterine cancer data set. (D) Number of CpGs that have adjusted R-squared values of at least 10% in the top 50,000 differentially variable CpGs. The black dashed line clearly indicates that less than 5% of the top 50,000 differentially variable CpG sites are explained by tumour purity. DV, differential variability; Adj Rsq, adjusted R-squared value.