
Figure 6.
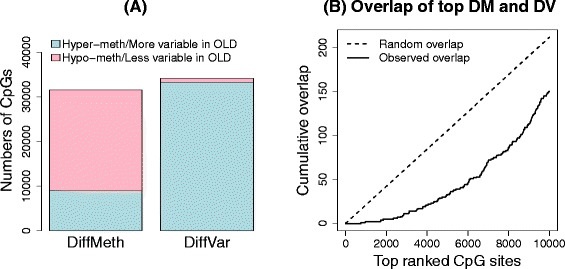
Analysis of aging data set. (A) Numbers of significantly differentially methylated (DM) and differentially variable (DV) CpG sites. (B) Overlap between the top 10,000 differentially methylated and differentially variable CpG sites. DM, differential methylation; DV, differential variability.