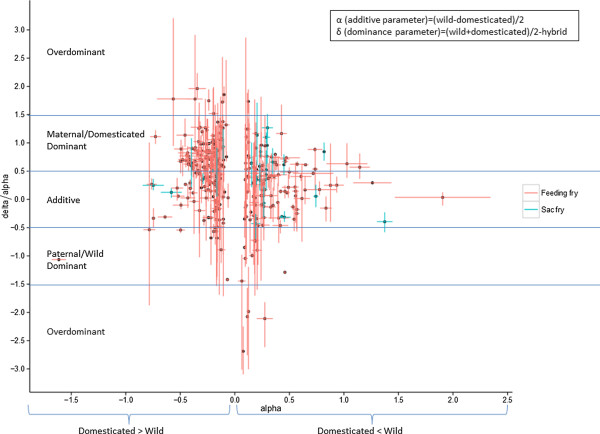
Figure 4.

Visual representation of heritability of annotated transcripts differentially expressed between experimental groups based on 1-way ANOVA (10% FDR). Error bars show the standard deviation between replicate arrays. Nine overdominant, one dominant and one recessive transcript were excluded from the graph for easier visualisation.
