
Figure 3. Relationship between Pareto front shape and population strategy.
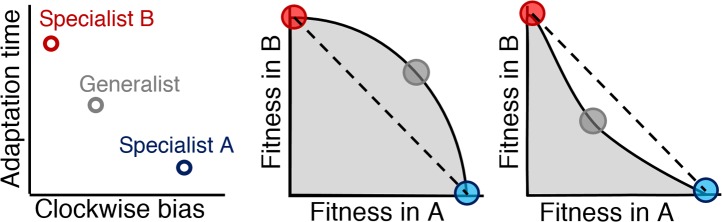
Left: Two environments, A and B, select for different optimal phenotypes, specialist A and specialist B (blue and red circles). The generalist phenotype (gray circle) performs well, but not optimally, in both environments. Middle and right: Trade-off plots. Gray region: fitness set composed of the fitness of all possible phenotypes in each environment; Black line: Pareto front of most competitive phenotypes; Dashed line: fitness of mixed populations of specialists; Circles: fitness of phenotypes corresponding the circles in the left plot. Middle: In a weak trade-off (convex front), the optimal population distribution will consist purely of a generalist phenotype that lies on the Pareto front. Right: In a strong trade-off (concave front), the optimal population will be distributed between the specialists for the different environments. Here, the fitness of a mixed population of specialists (dashed line), exceeds that of the generalist in both environments.