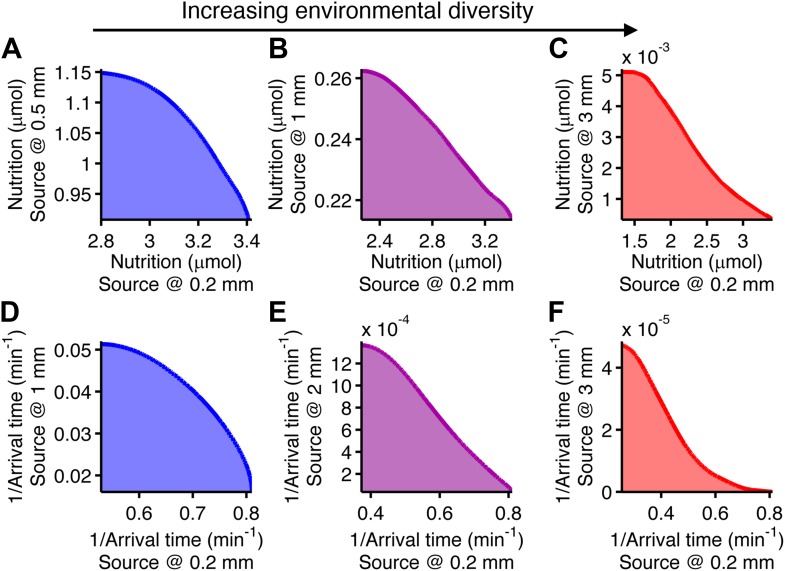
Figure 4. Performance trade-offs in E. coli chemotaxis.
Ecological chemotaxis tasks pose trade-off problems for E. coli that become strong when environmental variation is high. (A–C). Trade-off plot between nutrient accumulation when starting near and when starting far from a source. Plotting the performance of all possible clockwise bias and adaptation time combinations in both near and far cases (colored region) reveals the strength of the trade-off in the curvature of the front. As the disparity between starting distance becomes greater (left to right plots), the trade-off front goes from convex to concave, signifying a transition from weak to strong performance trade-offs. Source distances are indicated on axis labels. (D–F). Same as A–C but for the colonization challenge.

