. 2014 Oct 3;3:e03526. doi: 10.7554/eLife.03526

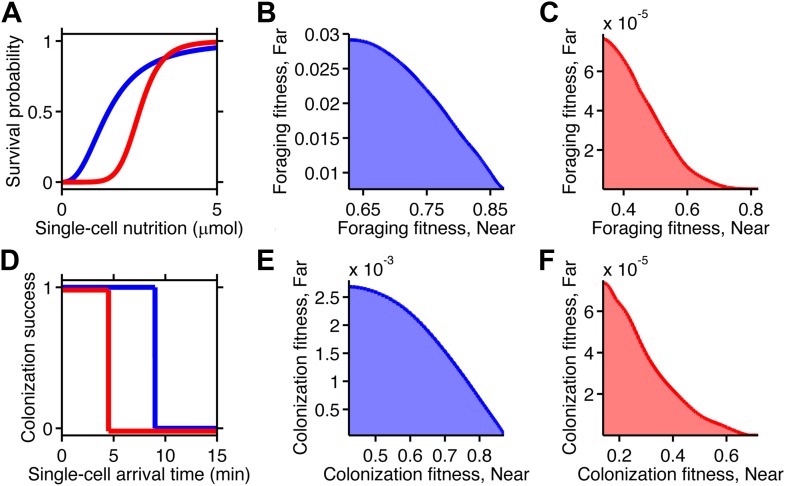
Figure 5. Selection can reshape trade-offs.

(A) Simple metabolic model of survival applied to the chemotactic foraging challenge. Each individual replicate is given a survival probability based on a Hill function of the nutrition they achieve from chemotaxis. For each phenotype, the foraging fitness is the average survival probability across replicates. The effect of more (red) and less (blue) stringent survival functions are compared. Transitional nutrition value: 1.5 µmol (blue), 2.5 µmol (red). Hill coefficient: 2.5 (blue), 7 (red). (B and C) Beginning with the neutral foraging performance trade-off in Figure 4B, application of the survival model in A gives rise to either a weak (B) or strong (C) fitness trade-off, depending on whether the thresholds and steepness are low (blue curve in A) or high (red curve in A). (D) Simple threshold model of survival applied to the chemotactic colonization challenge. Each individual replicate survives only if it arrives at the goal within the cut-off time. For each phenotype, the colonization fitness is the probability to colonize measured over all replicates. The effect of more (red) and less (blue) stringent survival functions are compared. Time threshold value: 5 min (blue), 1.5 min (red). (E and F) Beginning with the neutral colonization trade-off in Figure 4E, application of the selection model in (C) gives rise to either a weak (E) or strong (F) fitness trade-off.

DOI: http://dx.doi.org/10.7554/eLife.03526.015

Figure 5.

Figure 5—figure supplement 1. Fitness trade-offs under alternate models of selection.

Figure 5—figure supplement 1.

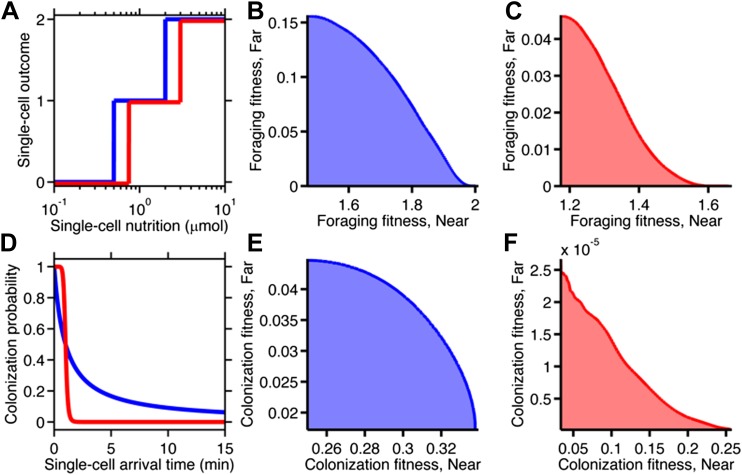
(A) Model of discrete physiological transitions applied to the chemotactic foraging challenge. Each individual replicate is given a number of progeny (0, 1, or 2) based on a two-step function of the nutrition they achieve from chemotaxis. For each phenotype, the foraging fitness is the average progeny across replicates. The effect of more (red) and less (blue) stringent nutrient requirements are compared. Survival requirement: 0.5 µmol (blue), 0.75 µmol (red), Division requirement: 2 µmol (blue), 3 µmol (red). (B and C) Beginning with the foraging performance trade-off in Figure 4B, application of the survival model in A gives rise to either a weak (B) or strong (C) fitness trade-off, depending on where the thresholds and steepness are low (blue curve in A) or high (red curve in A). D Probabilistic model of survival applied to the chemotactic colonization challenge. Each individual replicate survives has chance to survive depending on how soon it arrives. For each phenotype, the colonization fitness is the probability to colonize measured over all replicates. The effect of more (red) and less (blue) stringent survival functions are compared. Time threshold in both cases is 1 min with dependency 1 (blue) or 10 (red). (E and F) Beginning with the arrival performance trade-off in Figure 4E, application of the selection model in C gives rise to either a weak (E) or strong (F) fitness trade-off.