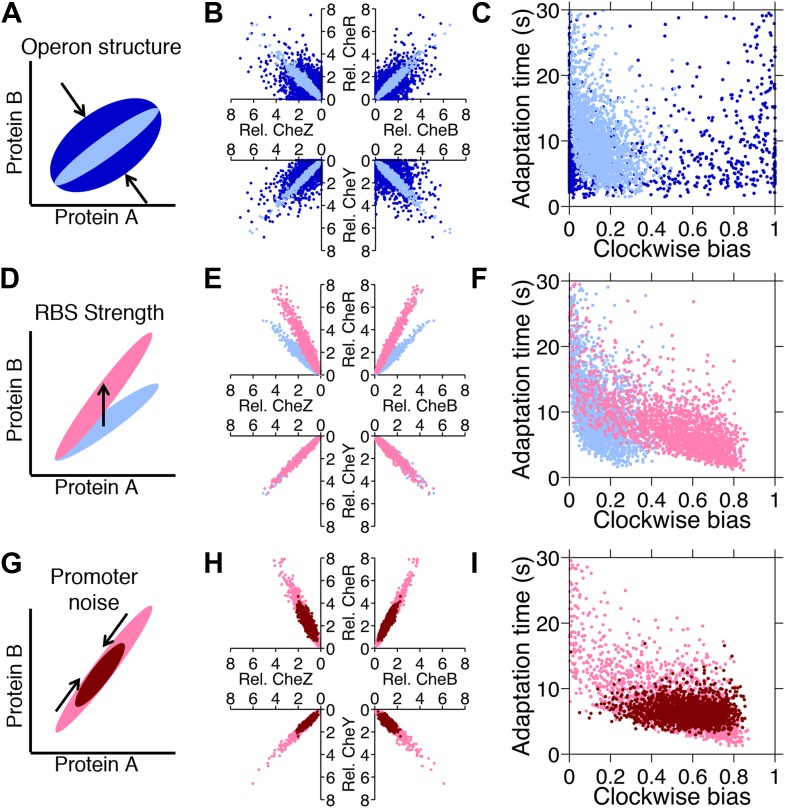
Figure 6. Genetic control of phenotypic diversity.
(A) Clustering genes on multicistronic operons constrains the ratios in protein abundance. (B) Protein expression of core chemotaxis proteins CheRBYZ are shown relative to the mean level in wildtype cells. Two thousand cells are plotted. Light blue: mean levels of the proteins CheRBYZAW and receptors are equal to the mean levels in wildtype cells, which we take to be 140, 240, 8200, 3200, 6700, 6700, 15,000 mol./cell, respectively (Li and Hazelbauer, 2004); the extrinsic noise scaling parameter, ω, is 0.26 and the intrinsic noise scaling parameter, η, is 0.125, which are both equal to wildtype levels (Figure 2—figure supplement 1). Dark blue: same but with ω = 0.8, which is greater than wildtype level. Note the substantial variability around the mean even in the case of wildtype noise levels (light blue). (C) Clockwise bias and adaptation time of individuals in (A). (D) Changes in the strength of individual RBSs will independently change the mean levels of individual proteins. (E and F) Light blue: gene expression of cells with same population parameters as in A, light blue. Pink: mean levels of CheR changed to twice wildtype mean. (G) Promoter sequences can be inherently more or less noisy, resulting in amplification or attenuation of the variability of total protein amounts without affecting protein ratios. (H and I) Pink: gene expression of cells with same population parameters as in (E), pink. Red: ω reduced from 0.26 to 0.1.

