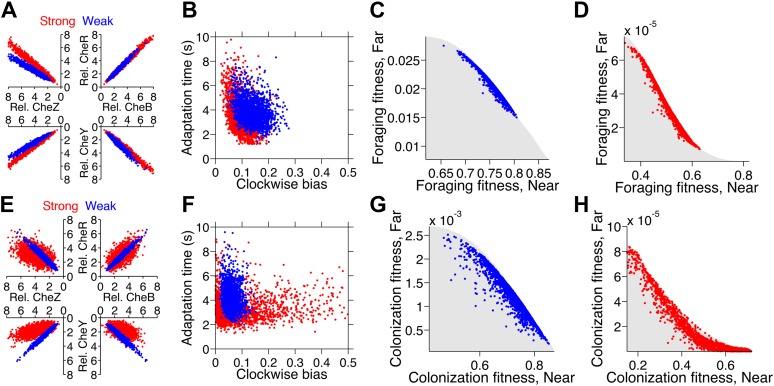
Figure 7. Optimization of gene expression noise reshapes population distributions to the Pareto front.
Protein expression of populations were optimized for either weak or strong foraging fitness trade-offs (same trade-offs as in Figure 5B,C). For each population, 2000 individuals are plotted, protein expression shown relative to the mean level in wildtype cells. (A) Gene expression parameters of the population optimized for the weak foraging trade-off: mean expression levels of CheRBYZAW and receptors relative to mean wildtype expression level were 2.54, 2.53, 2.50, 4.20, 4.50, 3.49, and 3.49 fold, respectively, with an intrinsic noise scaling parameter, η, of 0.051 and an extrinsic noise scaling parameter, ω, of noise 0.128. For the strong foraging trade-off: mean CheRBYZAW and receptors relative to wildtype were 3.27, 3.27, 2.86, 3.83 4.17, 2.82, and 5.00 fold, respectively, with η = 0.051 and ω = 0.200. (B) Clockwise bias and adaptation time of individuals in A with the corresponding dot color. (C) Fitness of the population that was optimized for the weak foraging trade-off (corresponding to blue dots in A and B). (D) Same as C but for the population optimized for the strong foraging trade-off. (E–H) Same as (A–D) for the colonization fitness trade-offs shown in Figure 5E,F. Population parameters optimized for weak colonization trade-off: mean CheRBYZAW and receptors levels relative to wildtype were 2.42, 2.52, 2.32, 2.50, 4.16, 3.25, and 5.00 fold, respectively, with η = 0.055 and ω = 0.126. Population parameters optimized for strong colonization trade-off: mean CheRBYZAW and receptors levels were 2.90, 2.92, 1.71, 3.845, 2.25, 3.80, and 3.76 fold, respectively, with η = 0.221 and ω = 0.090.

