
Figure 7. Glial LRP1 and LRP2 receptors move LTP across the BBB.
(A–F) Confocal brain sections at the level of the big commissure stained for LRP1 (A–C) or LRP2 (D–F) from controlYF larvae (A and D) or larvae with neuronal (B and E) or glial (C and F) knock-down of each receptor. Glial knock down reduces LRP1 and LRP2. (G–G′″) Average number of LTP-positive neurons/brain lobe (G) Repo-positive glia/brain (G′) or fraction of LTP-positive DRNs (G′″) in larval brains with glial knock-down of LRP1 and LRP2 singly or in combination, as indicated. Error bars indicate standard deviation. T-test significance: *p = 0.052, **p > 0.01, ***p < 0.001. (H–H″) control larvae (right) and larvae with glial knock-down of both LRP1/LRP2 (left) photographed at indicated times after egg collection. (I) Percent of control (n = 216, black) or double LRP1/LRP2 knock down (n = 183, red) larvae pupariating over time. (J–L′) Confocal stack projections of fat bodies from control (J and J′), fat body (K and K′) or glial (L and L′) LRP1,2 knock down larvae stained for FOXO (magenta) and DAPI (green). Scale bars = 20 μm. (M) Percent survival of control (n = 34, black) or glial LRP1/2 double knock-down (n = 33, red) flies fed with YF; grey line indicates 50% survival.

Figure 7—figure supplement 1. Neuronal LTP enrichments are reduced in lrp1,2.

Figure 7—figure supplement 2. Neuronal LTP enrichments are only mildly affected in lpr1,2.
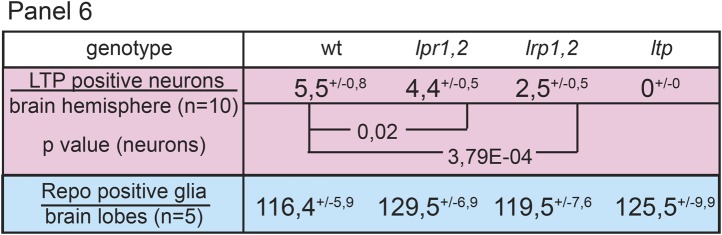
Figure 7—figure supplement 3. Both receptors, LRP1 and LRP2, promote LTP transport in glia.
