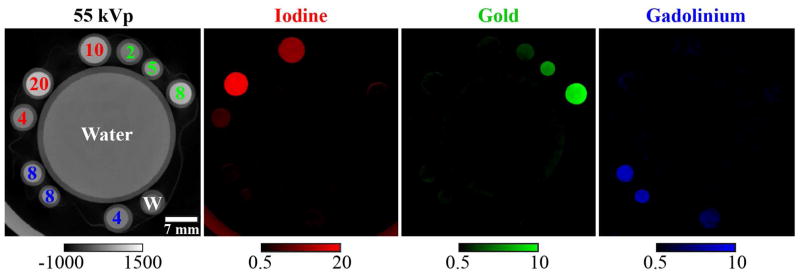
Figure 2. 3D physical calibration phantom.

A single, 2D slice through a 3D, physical calibration phantom consisting of vials containing unmixed concentrations of iodine, gold, and gadolinium in water as marked in mg/mL. Shown are the 55 kVp CT data after filtration with 3 iterations of spectral diffusion (calibration bar: Hounsfield units) and the corresponding three-material decomposition after the application of subspace projection (Equation 2.27; calibration bars: concentration in mg/mL). The RMSE of the mean concentrations measured in each vial over all vials is 1.04 mg/mL.
