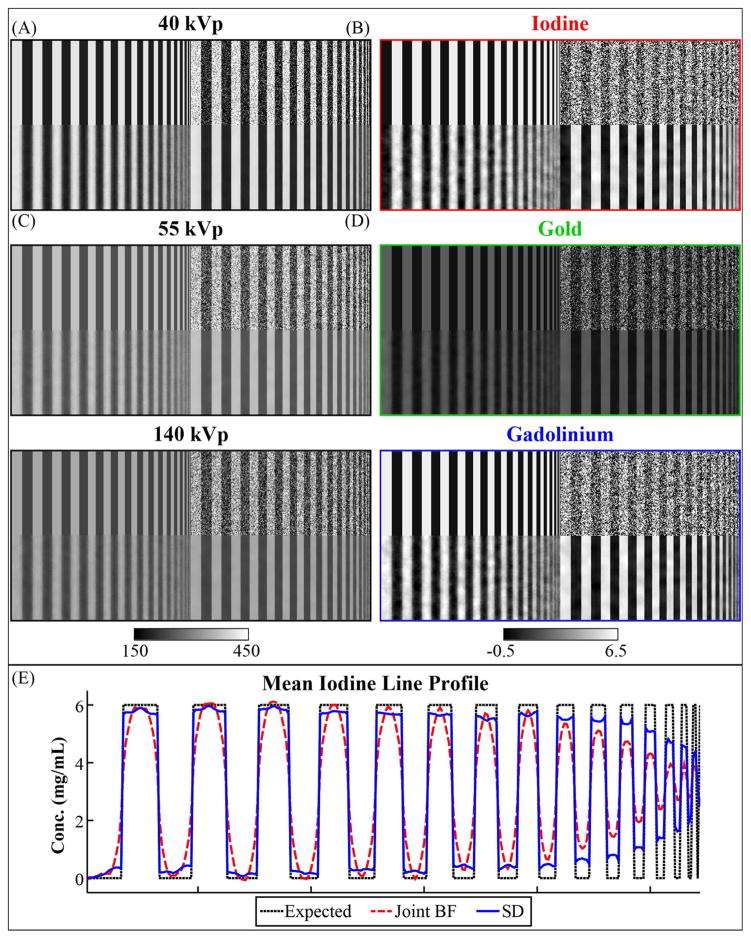
Figure 5. 3D digital bar phantom.
The central slice of sample, high contrast results comparing joint bilateral filtration (Joint BF) with spectral diffusion (SD) using equivalent filtration parameters. In this instance of the phantom, the task is to separate 6 mg/mL of iodine (even bars) from 6 mg/mL of gadolinium and 2 mg/mL of gold (mixed in odd bars). (A) Reference phantom. (B) Reference phantom after adding zero-mean, Gaussian noise with a standard deviation of 80 HU. (C) Image (B) after 3D, joint bilateral filtration integrating data from all three energies. (D) Image (B) after three iterations of spectral diffusion. Corresponding, post-filtration, material decomposition results are as shown in the second column before applying subspace projection. (E) Column-mean line profile for the iodine decomposition showing the iodine concentration bias as a function of spatial resolution (i.e. iodine modulation transfer).

