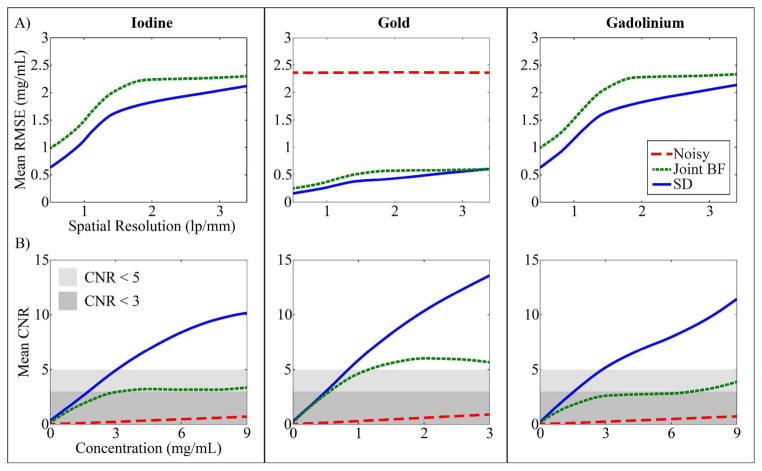
Figure 7. 3D digital bar phantom simulation results.
(Row A) Mean RMSE by spatial resolution (i.e. RMSE averaged over concentration) in separating the title material from mixtures of the other two. Results are shown for the original, “Noisy” data as well as after joint bilateral filtration (“Joint BF”) or three iterations of spectral diffusion (“SD”) with equivalent filtration parameters. “Noisy” results for iodine and gadolinium are constant at all spatial resolutions and are as listed in Table 2. Note that, in general, the results in Table 2 apply to the example in Figure 5 only. (B) Mean CNR by concentration (i.e. CNR averaged over spatial resolution) in separating the title material from mixtures of the other two. Shaded boxes indicate limits of detectability as labeled.

