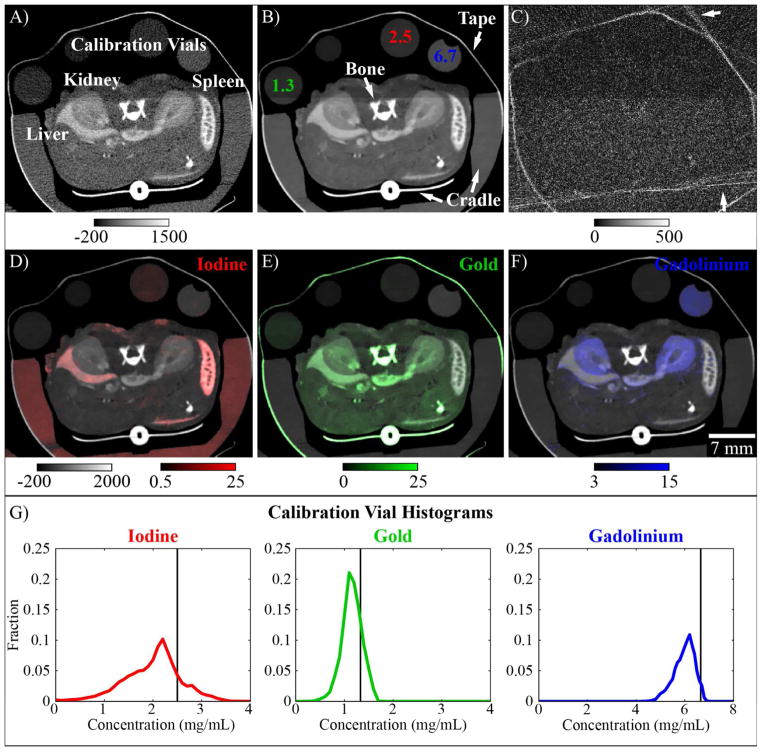
Figure 8. In vivo application of spectral diffusion.
(A) A single, 2D slice through the 55 kVp CT data with anatomy as labeled in white. (B) The 2D slice in (A) after three iterations of spectral diffusion. Calibration vials contain concentrations of the target materials in water as marked (mg/mL). The unlabeled vial contains water. Additional materials not accounted for in the decomposition are labeled in white (e.g. “Cradle”). (C) Absolute difference between (A) and (B). White arrows indicate removed high frequency artifacts which are caused by beam hardening correction of highly attenuating features. (D)–(F) Iodine, gold, and gadolinium maps (after subspace projection, Equation 2.27) overlaid on the 55 kVp data and scaled as shown in HU (CT data) and mg/mL (materials). (G) Histograms of material concentrations measured in the calibration vials labeled in (A) and (B). A black vertical line in each histogram indicates the known concentration in each calibration vial.

