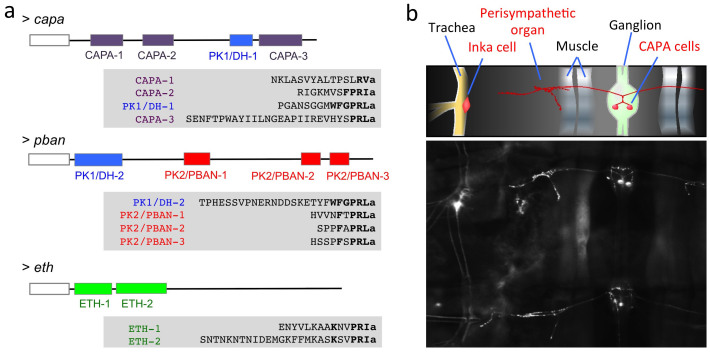
Figure 1. Three genes encoding –PRXamide peptide in the T. castaneum (a) and abdominal segments of a larva showing endocrine organs for ETH and CAPA visualized by immunohistochemistry (b).
(a) Schematic diagrams for CAPA, PBAN, and ETH genes are shown on the top line of each gene product. Mature peptides are shown as color coded boxes for each peptide family. Empty boxes to the left in each diagram indicate signal peptides. Sequences for each putative mature peptide are aligned according to conserved C-terminal amino acid sequence motifs marked in bold. The italic used in the N-terminus of sequence ETH-2 indicates uncertainty with the canonical cleavage signal in the middle of the ETH-2 as GK. This study used the shorter version of ETH-2 starting with FFM in the alternative predictions. (b) Immunostaining of –PRXamide-expressing neurons. The top inset is a schematic diagram depicting stained elements visible below. Ventral larval abdominal segments are shown for the CNS and trachea containing the cells for CAPA and for ETH (Inka cell), respectively, and for the perisympathetic organ, which serves as a neurohemal release site for the neuropeptide CAPA.

