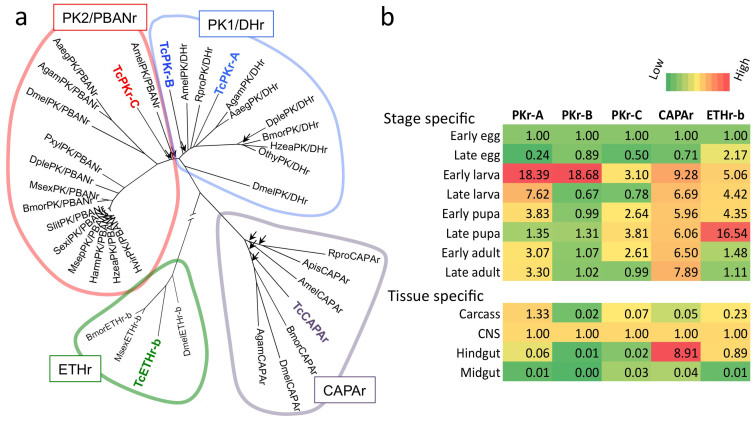
Figure 2. Five T. castaneum GPCRs belonging to the cluster of receptors for –PRXamide peptides (a) and their expression patterns (b).
(a) A total of five receptors, TcPKr-A, -B, and –C, TcCAPAr, and TcETHr appear within a group of four by phylogenetic criteria: PK2/PBANr, PK1/DHr, CAPAr, and ETHr. Arrowheads indicate bootstrapping values lower than 75, while all other nodes are supported by bootstrapping values higher than 75. Note that ETHr cluster is considerably separated from other clades. (b) Levels of mRNA for each receptor in different stages and tissues. Tissue specific expression data is for the late larval stage. The data show relative values for early egg in the stage specific data and for the CNS in the tissue specific data after normalization by rps3 expression.

