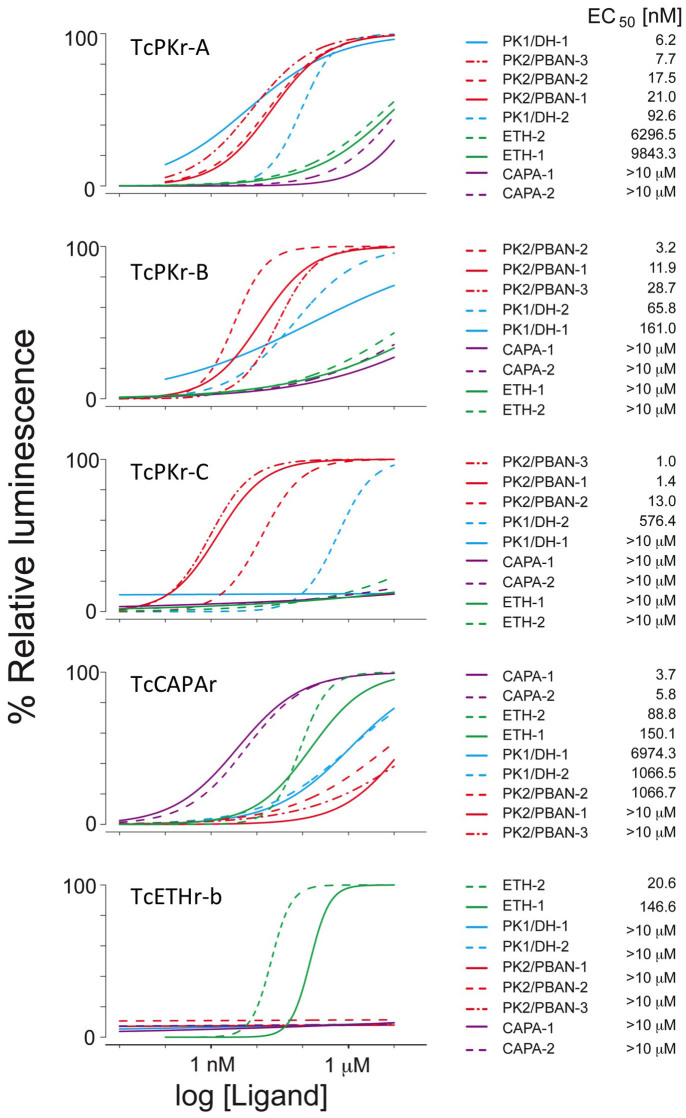
Figure 3. Dose-response curves of five different PRXamide receptors of T. castaneum for nine endogenous ligands.
Left panel shows dose-response curves for each receptor with 9 putative endogenous ligands. Right panel shows names of ligands and their EC50s in rank order. Values of data points are found in Supplementary Data 1.

