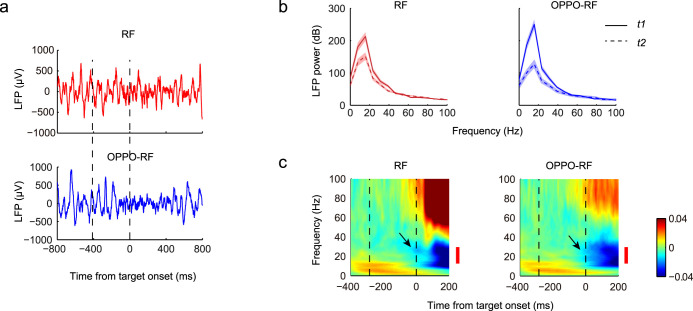
Figure 2. LFP fluctuations in the gap task.
(a), Examples of the single-trial LFP trace. The visual-evoked potential was discarded (see Methods). Data are from the same example neuron in Figure 1b. Two vertical dashed lines indicate the gap period. (b), Comparisons of LFP power between t1 (solid line) and t2 (dashed line) among all trials of the same example neuron. Flanking traces give s.e.m. (c), Time-frequency maps of spectral power, normalized to baseline. Data are from all recorded LIP neurons and are aligned on the target onset. Two vertical dashed lines indicate the averaged gap interval of all recorded neurons. Red bars denote the beta-band LFP (13–30 Hz). Black arrows denote the major LFP power decreases in t2, which mainly occurred in the beta-band.

