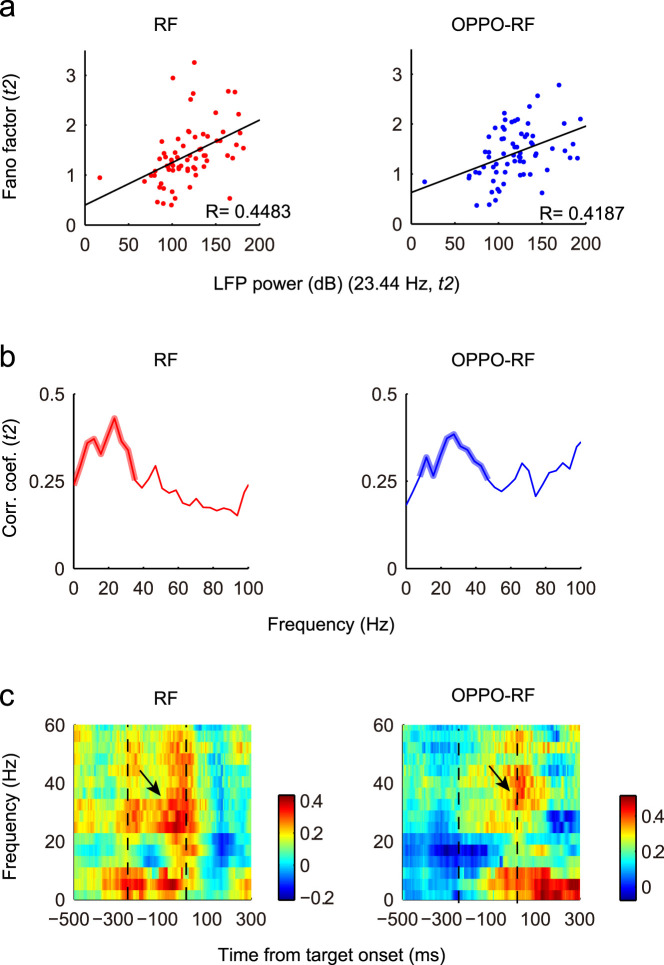
Figure 3. Correlation between neural variability and LFP power.
(a), The correlation between neural variability and 23.44 Hz LFP power in t2. Each dot represents the Fano factor of one neuron and the LFP recorded simultaneously. Black lines represent the linear regression. The correlation coefficients in the RF and OPPO-RF conditions were 0.4483 (p < 0.001, F-test) and 0.4187 (p < 0.001, F-test), respectively. (b), The distributions of correlation coefficients in t2 period in different frequency bands. Thicken lines indicate the significant correlation (p < 0.05, F-test). (c), Two-dimensional plots of the correlation coefficients. Time is on the x-axis; Frequency is on the y-axis. Correlation coefficient is color-coded on a linear scale. Two dashed lines indicate the averaged gap period. Black arrows denote the high correlation coefficients in t2.

