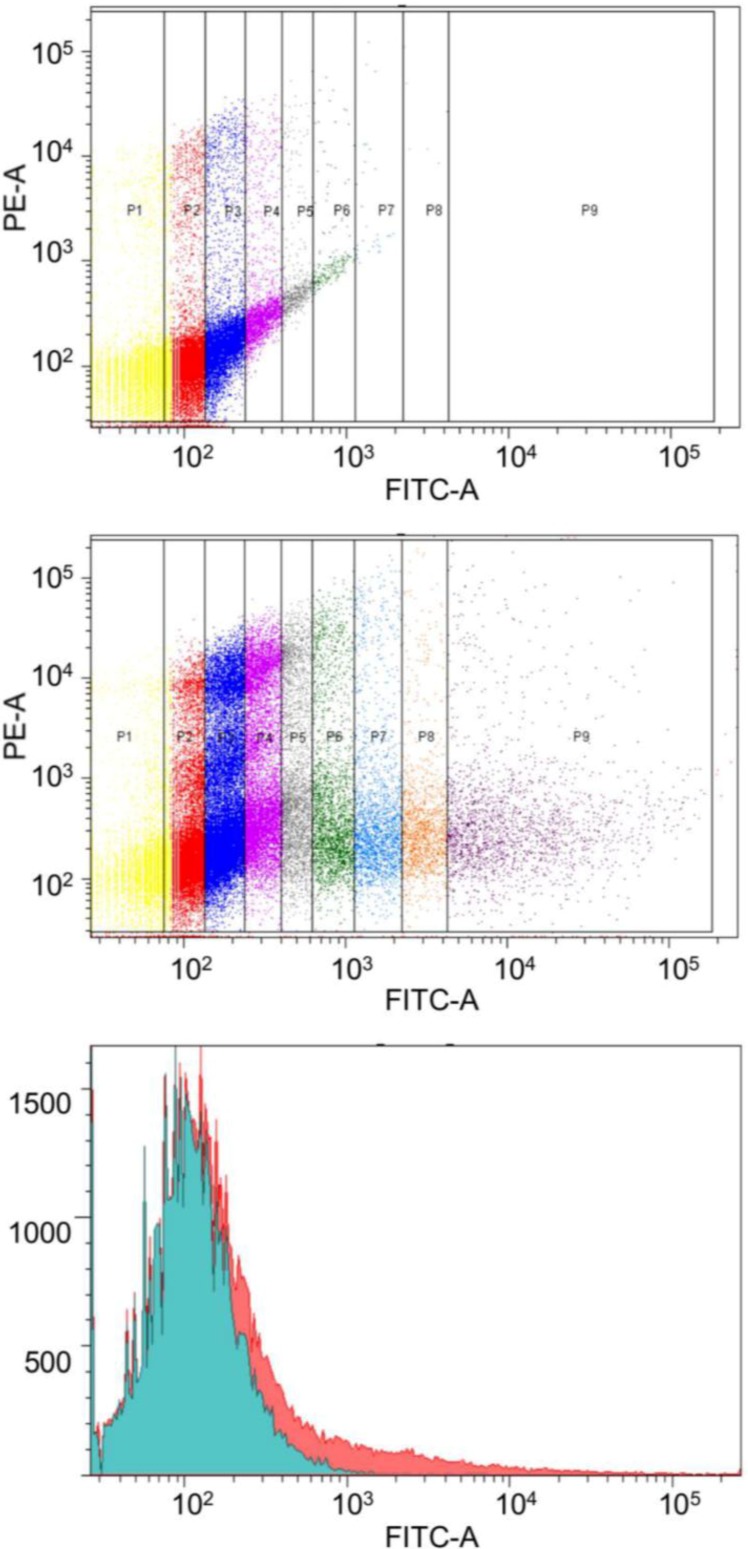
Figure 3.
Procedure for the flow cytometry analysis with EGFP marker gene. The top two graphs show division into compartments depending on signal strength for the channel FITC-A (signal from EGFP). The apparent difference between the cells transfected with the vector containing the EGFP protein (upper) from the control vector (the middle graph). Compartments from P2 to P8 are of equal width. P1 and P2 are located on the borders, their width was dependent on the maximum (minimum) capacities event registration by the instrument. Lower chart shows the quantitative difference between the number of cells in particular the FITC channel of transfected to untransfected cells.

