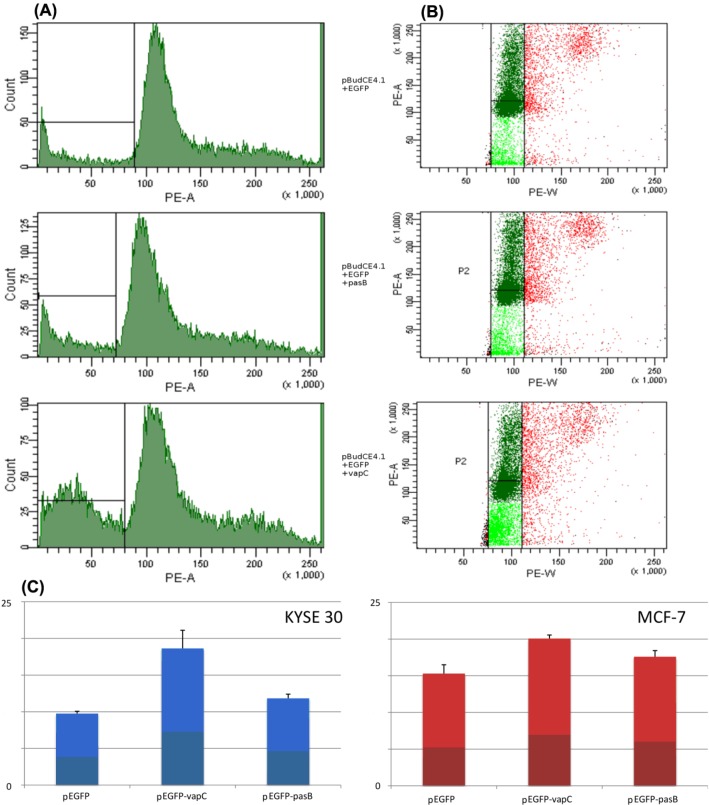
Figure 5.
Cell cycle analysis of cells transfected with constructs: pEGFP-PasB, pEGFP-VapC and control pEGFP. Histograms show propidium iodide signal strength (A) and population range (B) taken into analysis. Visible increase of Sub-G1 population, mostly for cells transfected with pEGFP-VapC. (C) histograms showing number (%) of cells in Sub-G1 phase (visible as light green on plots in section (C)).

