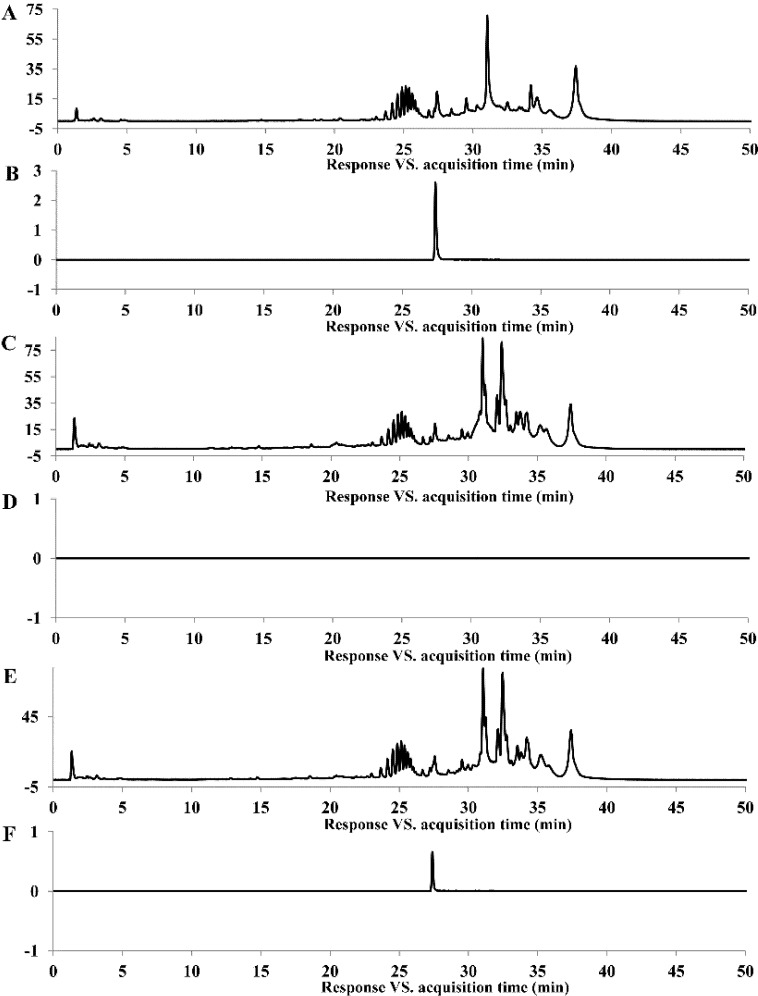
Figure 5.
LC-QTOF/MS profile of ZON degradation. (A) Electrospray ionization (ESI)total ion chromatogram (TIC) scan of positive control (0.15 mL AFB1 (50 ppm) solution was added to 1.35 mL NB for final concentration of 5 ppm. After incubation in the dark at 37 °C for 72 h, the samples were extracted with chloroform); (B) ESI extracted ion chromatogram (EIC) scan of positive control; (C) ESI TIC scan of negative control (0.15 mL methanol instead of AFB1 solution was used as negative control); (D) ESI EIC scan of negative control; (E) ESI TIC scan of sample (0.15 mL AFB1 (50 ppm) solution was added to 1.35 mL culture supernatant of N17-1 for final concentration of 5 ppm. After incubation in the dark at 37 °C for 72 h, the samples were extracted with chloroform); (F) ESI EIC scan of sample.

