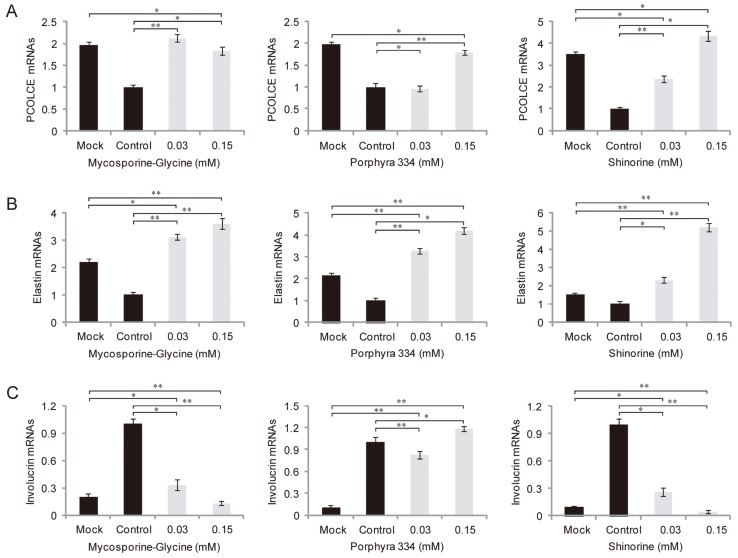
Figure 5.
Expression levels of procollagen C proteinase enhancer (PCOLCE) (A); elastin (B); and involucrin (C) mRNAs in response to different concentrations of MAAs under UV radiation. The error bars indicate standard deviations (means ± SD, n = 6). One-way ANOVA (p < 0.05); Post hoc Tukey test: * p < 0.01 and ** p < 0.001.

