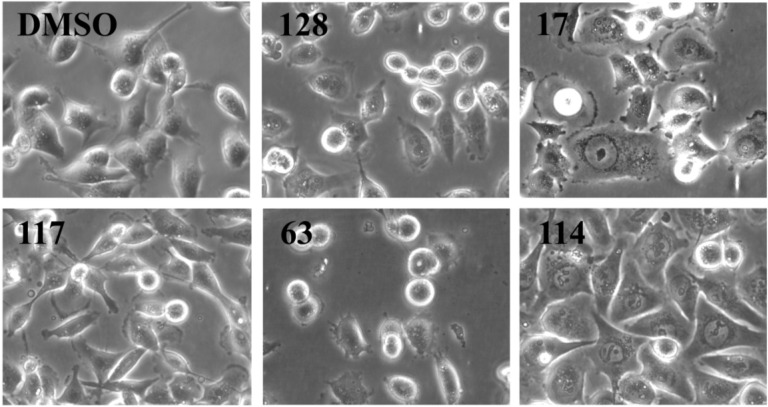
Figure 3.
Morphology analysis of MDA-MB-231 cells treated for 24 h with the indicated ascidian extracts (1 µge/µL). As controls, cells were treated with DMSO (0.1%). Part of the original images (Supplementary Figure S1) were zoomed in and presented below. Images were obtained with an Olympus IX70 microscope using a 10× objective.

