Figure 5.
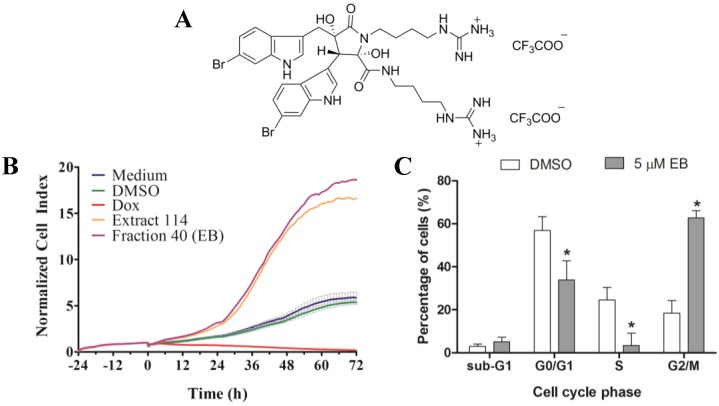
(A) Structure of the bis-TFA salt of eusynstyelamide B (EB, 1); (B) RTCA profile of MDA-MB-231 cells treated for 72 h with EB (1) and ascidian extract 114. As controls, cells were treated with DMSO (0.1%), doxorubicin (Dox, 10 µM), or remained untreated (medium); (C) Cells were treated for 72 h with 5 µM of EB (1) and cell cycle distribution (G0/G1, S and G2/M phase), and cell death (subG1) were measured by flow cytometry and quantified with ModFit LT 3.3 software (mean ± SD, n = 3). Statistically significant results (p < 0.05) are highlighted with an asterisk.

