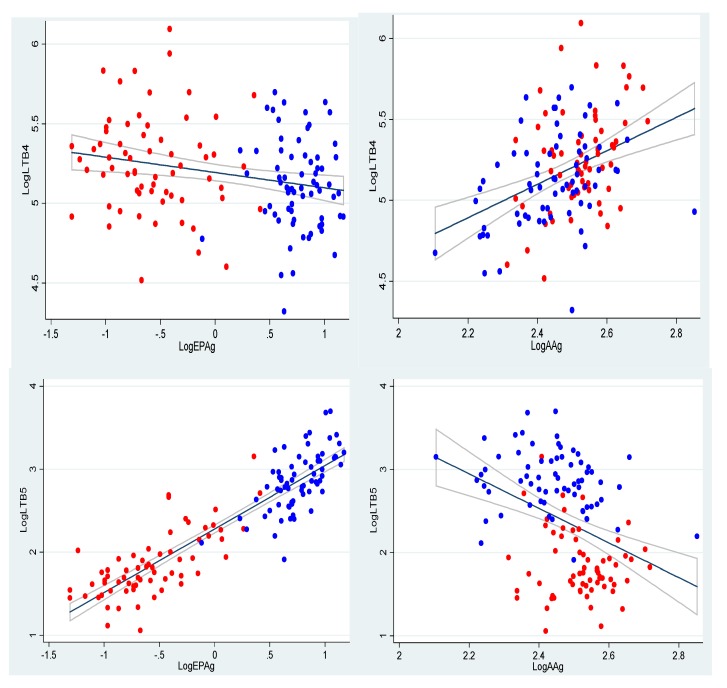
Figure 2.
Associations between log-transformed AAg (AA content in the cell membranes of the granulocytes) and EPAg (EPA content in the cell membranes of the granulocytes) in the neutrophils, as well as the formation of LTs (LTB4 and LTB5 (ng/107)) by neutrophils, illustrated using scatter plots with regression lines and confidence bands added. Control group, red dots; active group, blue dots.

