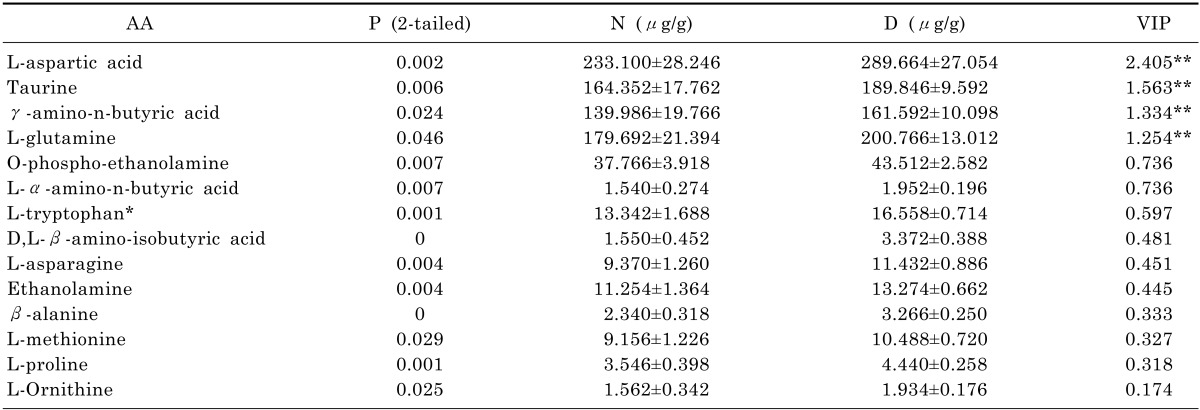
Table 4.
Key differentiating of AA between N and D in the OPLS-DA

Healthy control group (N) and CUMS model group (D) were expressed as mean±SD (n=7).
*The data was analyzed by Wilcoxon test. **VIP value>1.
Key differentiating of AA between N and D in the OPLS-DA

Healthy control group (N) and CUMS model group (D) were expressed as mean±SD (n=7).
*The data was analyzed by Wilcoxon test. **VIP value>1.