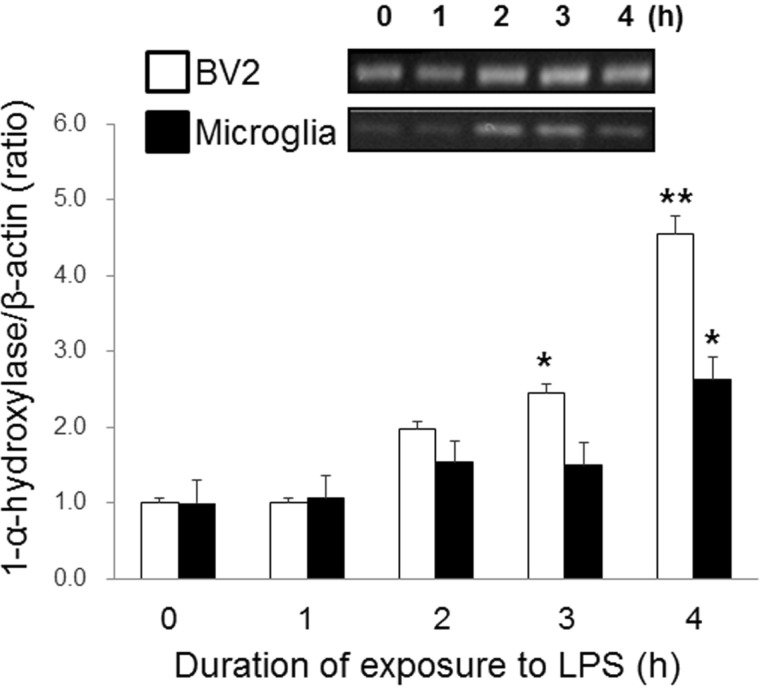
Fig. 2.
Effect of LPS on the expression of 1-α-hydroxylase in BV2 cells and primary microglia. The expression of 1-α-hydroxylase mRNA began to increase at 3 h of 100 ng/ml LPS treatment in BV2 cells and at 4 h in primary microglia. The mRNA expression of 1-α-hydroxylase were normalized with β-actin. The inset shows the representative RT-PCR product of 1-α-hydroxylase mRNA in BV-2 cells and microglia. Mean values were obtained from three independent experiments. *p<0.05, **p<0.01 when compared to the untreated control group (Student's t-test).

