
Table 3.
Maximal muscle strength of participants before and after study interventions
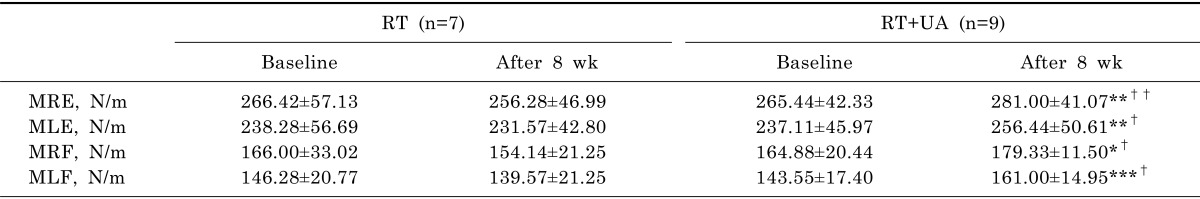
Values are expressed as mean±standard deviation. MRE, maximal right extension; MLE, maximal left extension; MRF, maximal right flexion; MLF, maximal left flexion. Within-group differences were analyzed by paired t-test (*p<0.05, **p<0.01, ***p<0.001). Analysis of variance was used for group-by-time interactions (†p<0.05, ††p<0.01).