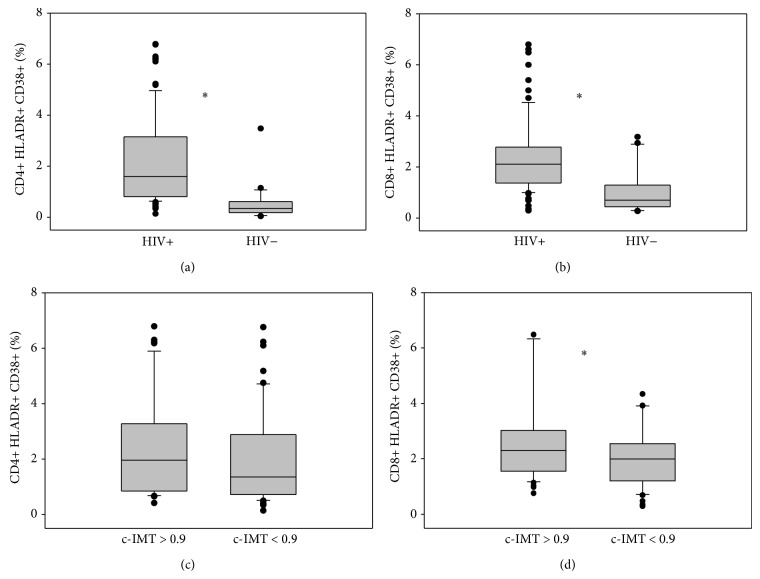
Figure 1.
CD4+ (a) and CD8+ (b) immune activation in HIV-infected subjects compared with HIV-negative controls. CD4+ (c) and CD8+ (d) immune activation in HIV-infected subjects according to c-IMT. Values are expressed as percentage. Horizontal bars represent median. Upper and lower whisker mean third quartile +1.5 (interquartile range (IQR)) and first quartile-1.5(IQR). *It represents a P value < 0.05.

