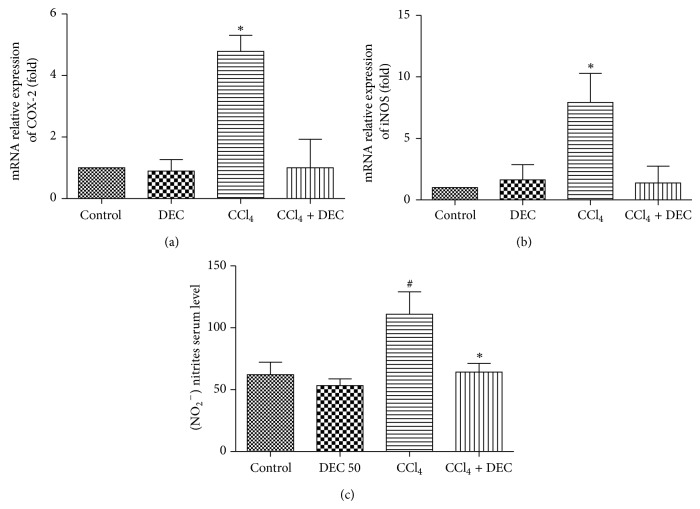
Figure 6.
(a) Relative expression of mRNA COX-2; (b) mRNA expression of iNOS. CCl4 group significantly increased mRNA COX-2 and iNOS expressions when compared with other groups. An asterisk represents a significant difference of the CCl4 group between groups. (c) Assessment of NO in serum through the measure of total nitrite metabolites. Quantification of NO (mean ± S.D., n = 6). # P < 0.05 when compared with control group; * P < 0.02 when compared with CCl4 group.

