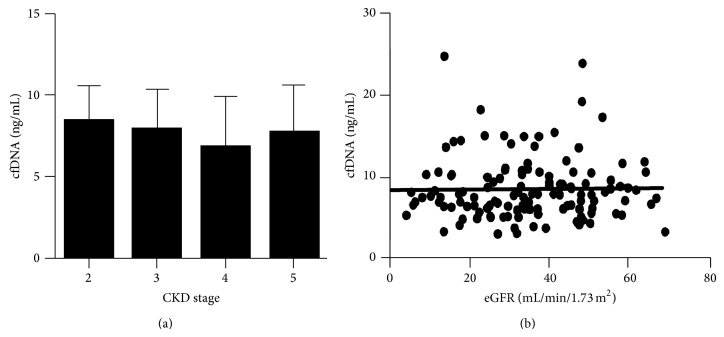
Figure 1.
Cell-free DNA levels in patients with renal impairment. (a) Comparison of cfDNA levels by CKD stage (mean and SD are shown). No difference in any group was evident (P = 0.49). (b) Correlation between estimated glomerular filtration rate (calculated using the 4-variable MDRD equation) and cfDNA levels for individual patients is shown (r 2 = 0.0002, P = 0.87).

