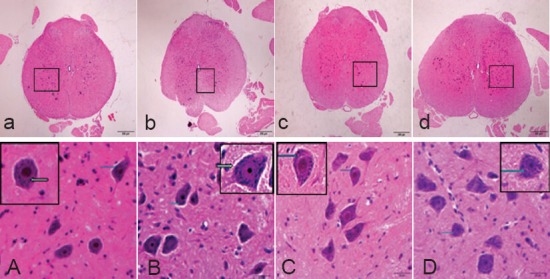
Figure 3.

Morphology of spinal cord in Sprague-Dawley rats for determination of the optimal treatment time of ginsenoside Rd (hematoxylin-eosin staining).
(a, A) 1 day after modeling; (b, B) 3 days after mod-eling; (c, C) 5 days after modeling; (d, D) 7 days after modeling. (a, A) There were large and round neurons, slightly stained nuclei, large nucleolus, and many Nissl bodies (arrows) in the cytoplasm. (b, B) The nuclei were slightly stained, nucleoli were clearly visible, and many Nissl bodies (arrows) were found in the cytoplasm. (c, C) The nuclei were slightly stained and many Nissl bodies (arrows) were found, there were more large neurons than A and B. (d, D) The nuclei were slightly stained and many Nissl bodies (arrows) were found, there were more large neurons than A and B. Original magnifi-cation, a–d: × 40, A–D: × 400, A–D are the magni-fied images of the boxes in a–d, respectively.
