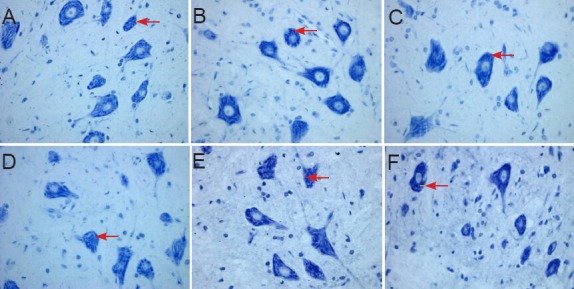
Figure 5.

Morphology of spinal cord sections in rats 5 days after spinal cord ischemia/reperfusion injury for the determination of the optimal dose of ginsenoside Rd (Nissl staining, × 400).
(A) Sham group; (B) ischemia/reperfusion injury group (I/R group); (C–F) 6.25, 12.5, 25, 50 mg/kg ginsenoside Rd groups. (A) In the sham group, spinal anterior horn moto-neurons were large; the nuclei were lightly stained, with a clearly visible nucleolus and a large amount of Nissl bodies in the cyto-plasm. (B) In the I/R group, there were large anterior horn motoneurons, lightly stained nuclei and clearly visible nucleoli, Nissl bod-ies that accumulated in the cytoplasm and were darkly stained. (C) 6.25 mg/kg ginse-noside Rd group: spinal anterior horn mo-toneurons were lightly stained and showed clear nucleoli, the content of Nissl bodies was high in the cytoplasm, which was lower than that in the I/R group, and the intensity of staining was lighter than that in the I/R group. (D–F) 12.5, 25, 50 mg/kg ginsenoside Rd groups: spinal anterior horn motor neu-rons showed light staining, clear nucleolus, and high content of Nissl bodies. Arrows indicate Nissl bodies.
