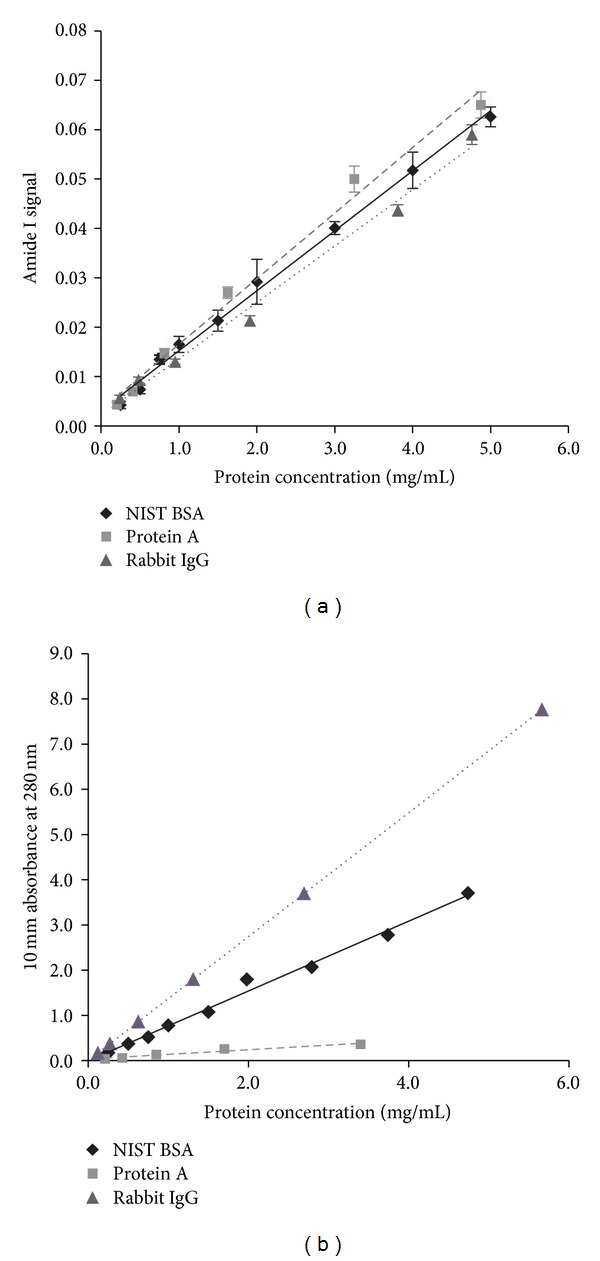
Figure 2.

Comparison of quantification of three different proteins (BSA, protein A, and rabbit ϒ-globulins) using either the MIR-based approach (a) or UV280 spectroscopy (b). Unlike MIR, each protein curve determined by UV possessed a different slope displaying the influence of protein sequence content.
