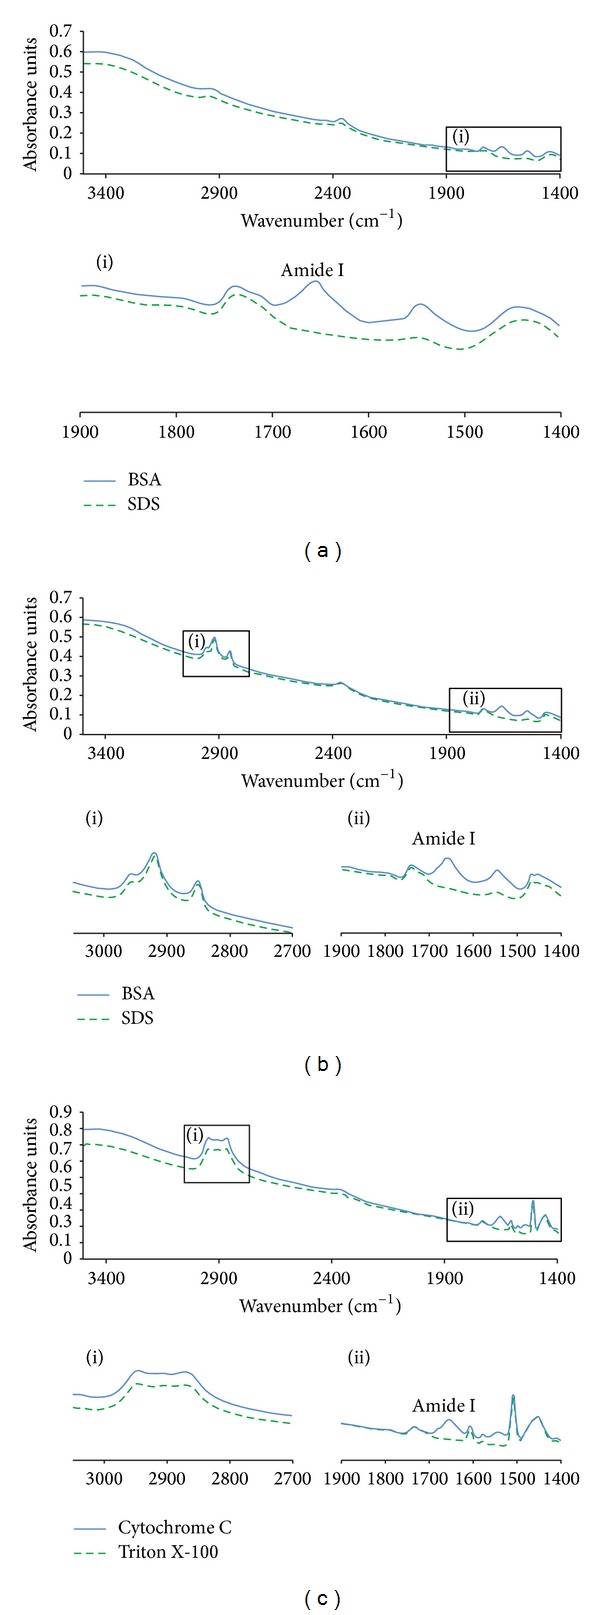
Figure 4.

MIR-based protein quantitation in the presence of reducing agents and detergents. The top part of each box shows IR signal registered between 3500 and 1400 cm−1. The bottom part of each box shows a magnification of areas of the MIR spectrum characteristic of protein (1500–1700 cm−1) and detergent (2800–3000 cm−1) signals. The spectra of the buffers containing respective detergent are shown in green. The MIR spectra of protein in the detergent containing buffers are shown in blue. The samples analyzed are as follows: (a) 4 mg/mL BSA in the presence of DTT, (b) 4 mg/mL BSA in the presence of 1% SDS, and (c) 5 mg/mL cytochrome C in the presence of 5% Triton X-100.
