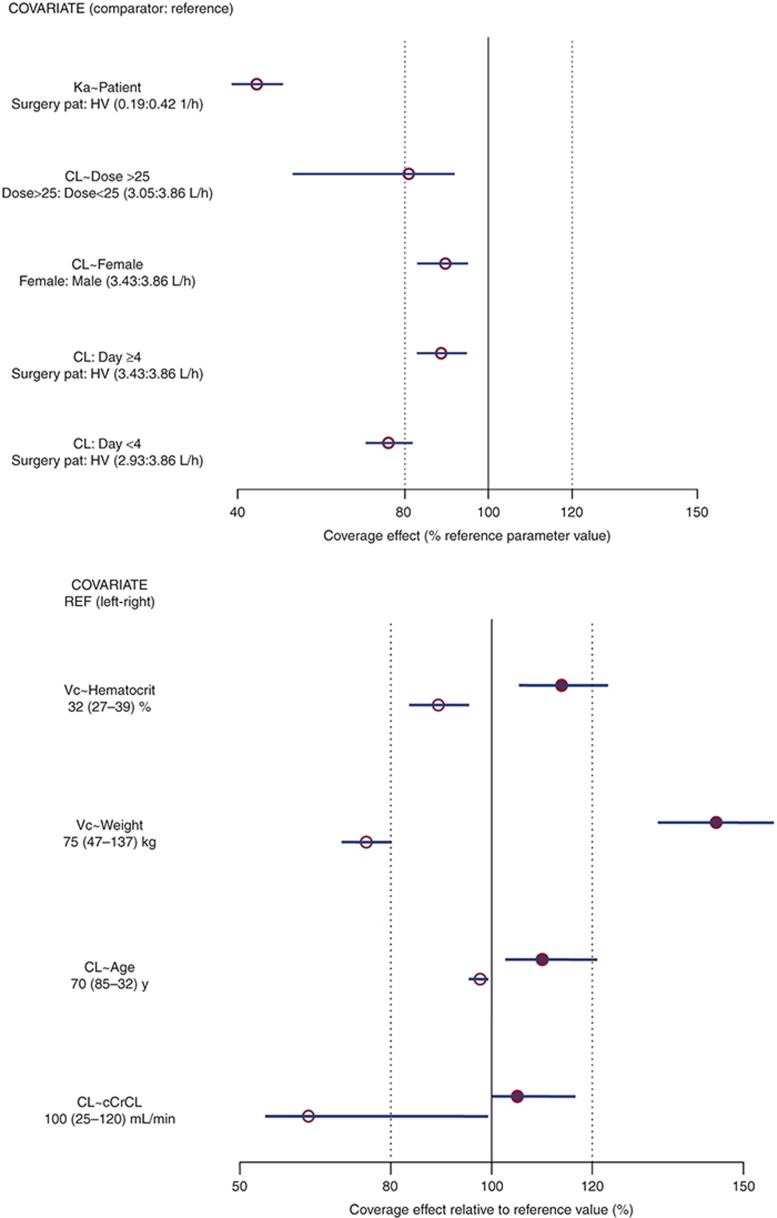
Figure 1.
Effects of covariates in the population pharmacokinetic model. (a) The effect of categorical covariates on CL and Ka; (b) the effect of continuous covariates on CL and Vc. Open circles represent point estimates of the parameter estimate for the comparator relative to the parameter estimate for the reference on the percentage scale, and error bars represent 95% confidence intervals of effect obtained from 500 bootstrap replications; solid vertical line represents the covariate effect at the reference value of the covariate; dotted vertical lines represent the indicators of ±20% covariate effect. For continuous covariate effects, the parameter estimates for the comparator at the lower and upper bounds of the covariate are compared with the parameter estimate at the reference value for the covariate. For example, CL in a subject with cCrCL of 25 ml/min is ~35% lower than CL at the reference cCrCL (100 ml/min). cCrCL, calculated creatinine clearance; CL, clearance; HV, healthy volunteer; Ka, absorption rate constant; pat, patient; Vc, volume of distribution for central compartment.

