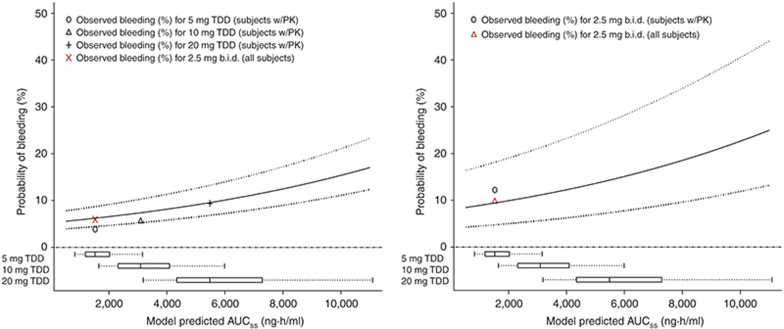
Figure 3.
Exposure–response relationship for bleeding (including major bleeding, minor bleeding, potentially significant nonovert bleeding, clinically relevant nonmajor bleeding, and fatal bleeding) in TKR (ADVANCE 2, left panel) and THR (ADVANCE 3, right panel) subjects. Solid line represents the median bleeding probability and dotted lines represent the 95% confidence intervals. Observed bleeding (%) in “subjects w/PK” indicates the subjects in the E-R analysis dataset, whereas “all subjects” indicates the observed rate from the overall ADVANCE 2 and 3 populations, respectively. AUCss, area under plasma concentration–time curve at steady state; b.i.d., twice daily; TDD, total daily dose; THR, total hip replacement; TKR, total knee replacement.

